Issue
The default colors used in matplotlib (example here: http://matplotlib.org/examples/pylab_examples/pie_demo.html) are kind of plain and ugly. I've also noticed that if you plot more than 5-6 different series in a single plot, matplotlib starts repeating colors.
I've seen some gorgeous graphs coming out of other visualization packages (in other languages, by default) that can have 5-6 different series covered by just one color in different shades. Does anyone have a good color set to use in matplotlib? And a way to make matplotlib use it by default?
Solution
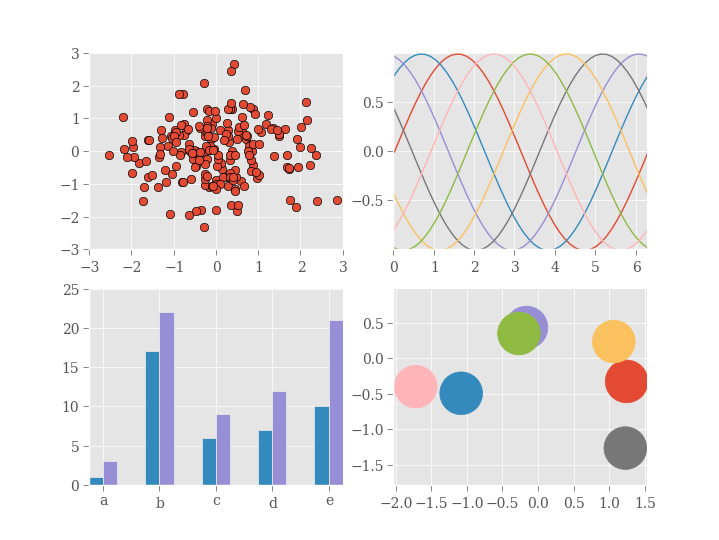
You can use Matplotlib's style sheets. It has been ported from the mpltools library which has a style module that redefine matplotlib rc parameters.
As an example, see the use of the ggplot style and Matplotlib's manual.

Answered By - gcalmettes

0 comments:
Post a Comment
Note: Only a member of this blog may post a comment.